Contents
- 1 Utilizing a Basal Body Temperature (BBT) Chart for Effective Pregnancy Tracking: A Comprehensive Guide
- 1.1 Understanding BBT Charts for Tracking Pregnancy
- 1.2 What is a BBT Chart?
- 1.3 Benefits of Tracking Pregnancy with a BBT Chart
- 1.4 FAQ about topic How to Use a BBT Chart to Track Pregnancy
- 1.4.1 What is a BBT chart?
- 1.4.2 How do I use a BBT chart to track my pregnancy?
- 1.4.3 What is the significance of basal body temperature during pregnancy?
- 1.4.4 Can a BBT chart be used as a reliable method of birth control?
- 1.4.5 What are some tips for accurately tracking BBT?
- 1.4.6 What is a BBT chart?
- 1.4.7 How can I use a BBT chart to track my pregnancy?
Utilizing a Basal Body Temperature (BBT) Chart for Effective Pregnancy Tracking: A Comprehensive Guide

Tracking your basal body temperature (BBT) can be a useful tool in determining if you are pregnant. BBT is your body’s temperature at rest, and it can fluctuate throughout your menstrual cycle. By charting your BBT, you can identify patterns that may indicate ovulation, fertility, and even conception.
When you are trying to conceive, monitoring your BBT can help you pinpoint your most fertile days. After ovulation, your BBT will rise slightly and stay elevated until your next period. If you see a sustained temperature increase for at least 18 days, it could be a sign that you are pregnant.
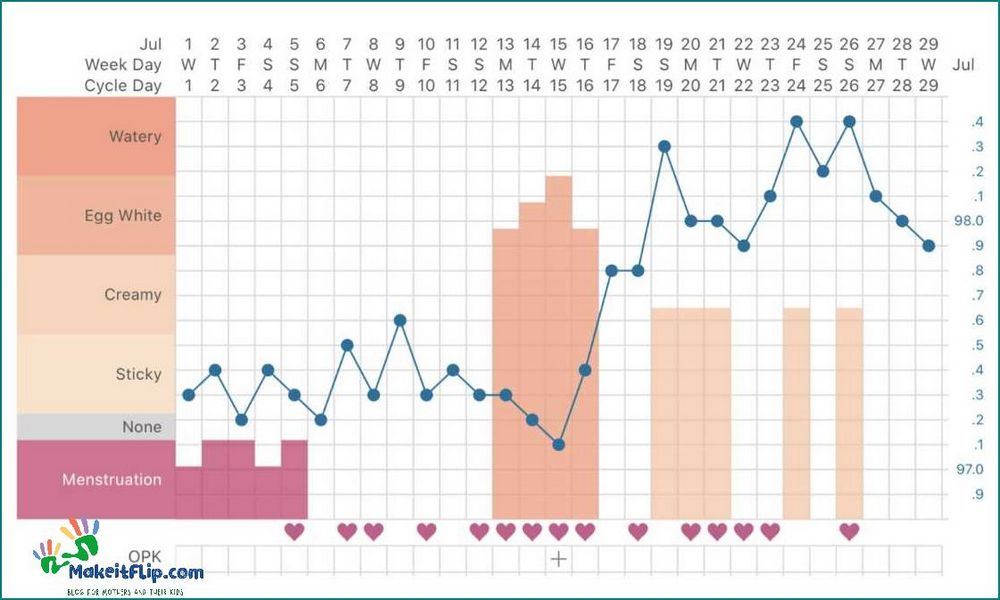
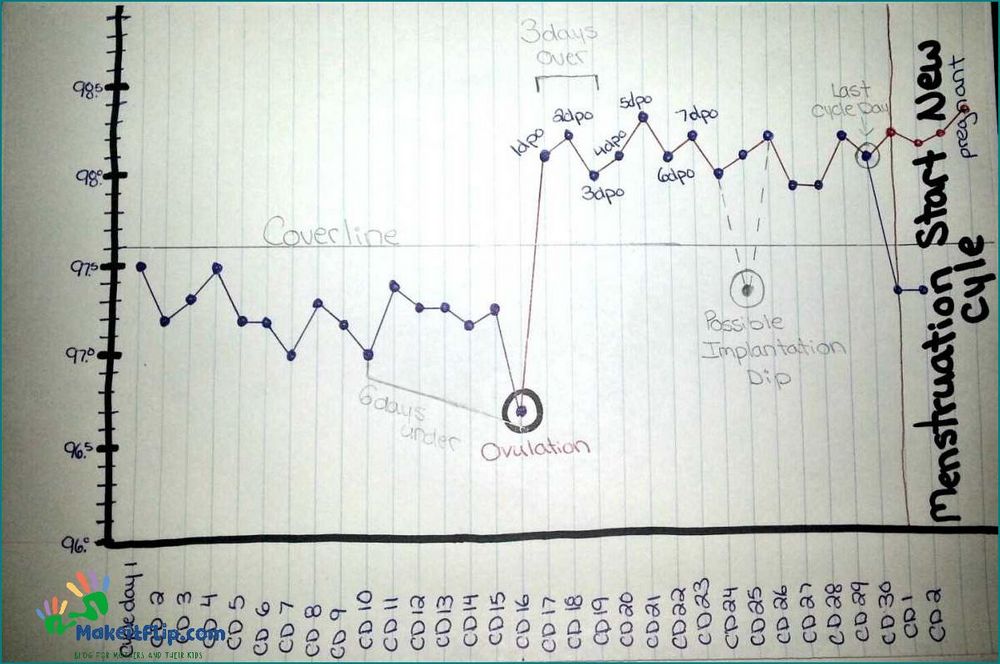
Using a BBT chart is simple. Each morning before you get out of bed, take your temperature using a BBT thermometer and record it on your chart. Over time, you will start to see a pattern emerge. Look for a temperature dip followed by a rise, which indicates ovulation. If your temperature remains elevated for more than two weeks, it may suggest implantation and pregnancy.
Remember that BBT charting is not foolproof, and it is best used in conjunction with other fertility tracking methods. It is also important to note that BBT charting cannot confirm a pregnancy; it can only provide clues. If you suspect you may be pregnant, it is always best to consult with a healthcare professional for confirmation.
Understanding BBT Charts for Tracking Pregnancy

A Basal Body Temperature (BBT) chart is a useful tool for tracking pregnancy. BBT is the lowest body temperature at rest, usually measured in the morning before any physical activity. By tracking your BBT over time, you can gain insights into your fertility and identify patterns that may indicate pregnancy.
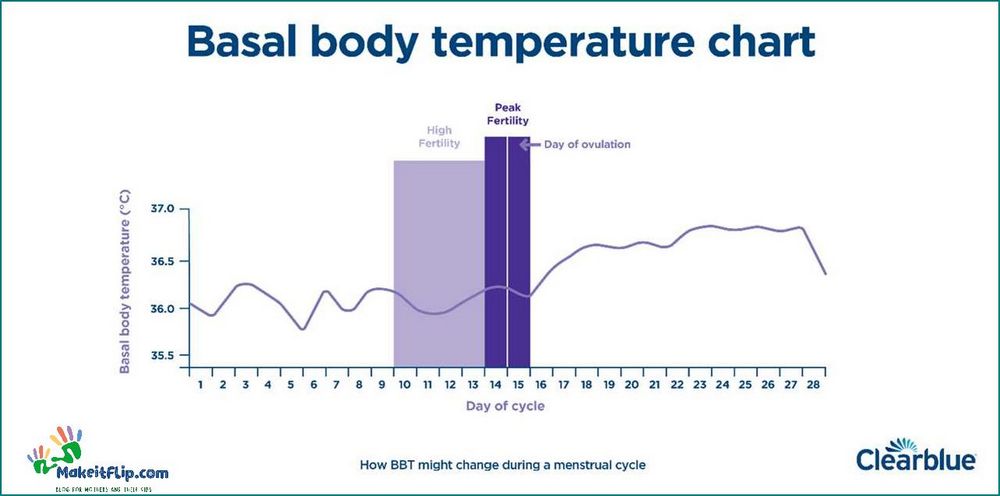
When trying to conceive, a BBT chart can help you pinpoint your most fertile days. During the menstrual cycle, a woman’s BBT typically remains low before ovulation and then rises after ovulation. This temperature shift indicates that ovulation has occurred. By tracking your BBT, you can identify the best time to have intercourse for conception.
Once conception has taken place, the BBT chart can continue to be used to track the pregnancy. After implantation, the BBT may remain elevated, indicating that pregnancy has occurred. This sustained increase in temperature is due to the hormone progesterone, which is produced by the developing placenta.
It’s important to note that a BBT chart alone cannot confirm pregnancy, but it can provide valuable information about your fertility and help you understand your menstrual cycle better. If you notice a sustained increase in your BBT for more than 18 days, it may indicate a possible pregnancy.
When tracking your BBT, it’s essential to use a reliable thermometer and measure your temperature at the same time every morning. Record your temperature on a chart or in a fertility tracking app to track any changes over time. By consistently tracking your BBT, you can gain a better understanding of your fertility and increase your chances of conceiving.
In conclusion, understanding BBT charts for tracking pregnancy can provide valuable insights into your fertility and help you identify patterns that may indicate pregnancy. By consistently tracking your BBT and observing changes over time, you can increase your chances of conceiving and have a better understanding of your menstrual cycle.
What is a BBT Chart?

A BBT chart, also known as a basal body temperature chart, is a tool used to track a woman’s menstrual cycle and fertility. BBT refers to the body’s basal temperature, which is the lowest temperature reached during rest. By recording this temperature daily, women can identify patterns and changes in their cycle that may indicate ovulation, conception, or pregnancy.
During a woman’s menstrual cycle, her BBT typically fluctuates due to hormonal changes. After ovulation, the hormone progesterone is released, causing a slight increase in body temperature. This increase can be detected on a BBT chart and may indicate that ovulation has occurred.
If conception and implantation occur, the BBT will remain elevated, indicating pregnancy. However, if fertilization does not occur, the BBT will drop again, signaling the start of a new cycle.
Using a BBT chart can help women track their fertility and identify the most fertile days of their cycle. By monitoring changes in temperature, women can predict when they are most likely to ovulate and increase their chances of getting pregnant.
Overall, a BBT chart is a valuable tool for women who are trying to conceive or simply want to understand their menstrual cycle better. By tracking their BBT, women can gain insight into their fertility and make informed decisions about family planning.
How to create and interpret a BBT chart

A BBT chart is a useful tool for tracking fertility and determining the best time to conceive. Here are the steps to create and interpret a BBT chart:
1. Get a basal body temperature (BBT) thermometer: A BBT thermometer is more sensitive than a regular thermometer and can measure small changes in your body temperature. It is important to use the same thermometer throughout your cycle.
2. Take your temperature every morning: Take your temperature at the same time every morning, before getting out of bed or engaging in any physical activity. This will ensure consistent and accurate readings.
3. Record your temperature on the chart: Use a BBT chart to record your temperature every day. The chart should have a space for each day of your cycle. You can find printable BBT charts online or use a fertility tracking app.
4. Look for patterns: After a few weeks of recording your temperature, look for patterns in your chart. Your BBT will typically be lower during the first half of your cycle and higher during the second half. A significant rise in temperature may indicate ovulation.
5. Track other fertility signs: Along with your temperature, track other fertility signs such as cervical mucus, ovulation pain, and changes in the cervix. This will provide a more comprehensive picture of your fertility and help you pinpoint your most fertile days.
6. Determine ovulation: Ovulation usually occurs the day before or the day of the temperature rise. By tracking your BBT and other fertility signs, you can identify your fertile window and increase your chances of conception.
7. Continue charting: Keep charting your BBT throughout your cycle, even after you suspect you may be pregnant. A sustained rise in temperature beyond your usual luteal phase length may indicate pregnancy.
Remember, a BBT chart is just one tool in tracking fertility. It is important to consult with a healthcare professional for a comprehensive evaluation of your fertility and to address any concerns or questions you may have.
Benefits of Tracking Pregnancy with a BBT Chart

Tracking your pregnancy with a Basal Body Temperature (BBT) chart can provide valuable insights into your fertility and conception journey. By monitoring your BBT throughout your menstrual cycle, you can gain a better understanding of your body’s natural rhythm and increase your chances of getting pregnant.
One of the main benefits of using a BBT chart is that it helps you identify your fertile window. Your BBT typically rises after ovulation, indicating that you have entered the luteal phase of your menstrual cycle. By tracking these temperature changes, you can pinpoint the best time to try to conceive.
Additionally, a BBT chart can help you confirm if you are pregnant. If your temperatures remain elevated for more than 18 days after ovulation, it could be a sign of pregnancy. This sustained increase in temperature is due to the implantation of the fertilized egg and the release of the hormone progesterone.
Using a BBT chart can also provide reassurance during the early stages of pregnancy. If you notice a consistent rise in your temperatures and they remain elevated, it can indicate a healthy pregnancy. On the other hand, a sudden drop in temperatures may be a sign of a potential miscarriage or other complications.
Furthermore, tracking your BBT can help you detect any irregularities in your menstrual cycle. If you notice significant variations in your temperatures or a lack of temperature shift after ovulation, it could be an indication of hormonal imbalances or other fertility issues. By identifying these issues early on, you can seek appropriate medical intervention and increase your chances of successful conception.
In conclusion, tracking your pregnancy with a BBT chart offers numerous benefits. It helps you identify your fertile window, confirm pregnancy, provide reassurance, and detect any irregularities in your menstrual cycle. By utilizing this simple and cost-effective method, you can enhance your understanding of your body’s fertility and increase your chances of achieving a healthy pregnancy.
FAQ about topic How to Use a BBT Chart to Track Pregnancy
What is a BBT chart?
A BBT chart is a chart that tracks a woman’s basal body temperature (BBT) throughout her menstrual cycle. It is used to help track ovulation and fertility.
How do I use a BBT chart to track my pregnancy?
A BBT chart can be used to track pregnancy by monitoring changes in basal body temperature. After ovulation, if the temperature remains elevated for more than two weeks, it may indicate pregnancy.
What is the significance of basal body temperature during pregnancy?
Basal body temperature during pregnancy can help determine if implantation has occurred and can be an early indicator of pregnancy. It can also be used to track the progress of pregnancy and monitor any changes in temperature that may indicate potential issues.
Can a BBT chart be used as a reliable method of birth control?
A BBT chart can be used as a method of natural family planning, but it is not considered a highly reliable form of birth control on its own. It is best used in conjunction with other methods to track fertility and ovulation.
What are some tips for accurately tracking BBT?
To accurately track BBT, it is important to measure temperature at the same time every morning before getting out of bed. It is also helpful to use a basal body thermometer, which is more sensitive to small changes in temperature. Consistency and accuracy are key for reliable tracking.
What is a BBT chart?
A BBT chart is a record of a woman’s basal body temperature (BBT) taken every morning before getting out of bed. It is used to track changes in temperature throughout the menstrual cycle.
How can I use a BBT chart to track my pregnancy?
A BBT chart can be used to track pregnancy by monitoring changes in temperature after ovulation. If the temperature remains elevated for more than two weeks, it may indicate pregnancy.
I’m Diana Ricciardi, the author behind Makeitflip.com. My blog is a dedicated space for mothers and their kids, where I share valuable insights, tips, and information to make parenting a bit easier and more enjoyable.
From finding the best booster seat high chair for your child, understanding the connection between sciatica and hip pain, to exploring the benefits of pooping in relieving acid reflux, I cover a range of topics that are essential for every parent.
My goal is to provide you with practical advice and solutions that you can easily incorporate into your daily life, ensuring that you and your child have the best possible experience during these precious years.
